40
Vlad changed the title to Check RAM usage .

    Vlad Hi Vlad, please find attached to this thread a video showing an easy to reproduce out-of-memory situation with streaming under the latest RC [Version 0.99.127.3.2-rc (WebKit 619.1.11.111.2) / Build date Jun 8 2024] on Mojave. While I don't see the issue with all video streaming with Orion on Mojave, this one is easy to reproduce and I have seen the same issue with this site streaming under more recent macOS, though at least an order of magnitude less significant. I thought this would be a good example since as you can see from the video of my streaming session, my system runs out of memory in less than 10 minutes streaming from this site:
    https://www.classicartsshowcase.org/watch-classic-arts-showcase/

    This is reproducible everytime with this site. Opening the same site on the same system in Safari (14.1.2) has no issue (it quickly consumes up to a GB of RAM but I can let it stream for hours without issue).

    Memory usage really explodes after the 3:50 mark, but I included the video from pre-load through to close so you can the full cycle of the issue. Up until ~ 3:50 you can see memory usage gradually racheting up every 20-30 seconds.

    As far as the recording I uploaded, I downsampled it to 540p and 3fps to keep the upload file small. However, I have the original 1080p/60 screen recording if higher framerate or resolution is needed.

    If you can't reproduce on your Mojave test system within 10 minutes of streaming that link, let me know.

    P.S.I have no idea why macOS's Activity Monitor shows individual process memory usage relatively low the entire time while system Memory and App Usage (and then Compressed) going up constantly.

    • Vlad replied to this.

      bzgnyc Please include exact steps to reproduce, including the URL.

        Vlad Basically:

        1. Start with Mojave system (test system is a Mac Mini 2018 w/8GB of RAM running final Mojave release/patches)
        2. Open Orion browser (in the above was running 0.99.127.3.2-rc)
        3. Open link (https://www.classicartsshowcase.org/watch-classic-arts-showcase/)
        4. Hit play
        5. Watch Memory Used/etc rachet up ~ 300MB every 25-30 seconds in Activity Monitor
        6. After 3:50 of streaming, Memory Pressure explodes and it really starts to swap
        7. Letting it continue after that hat will cause macOS to report an low memory situation and suggest killing processes; after that it will start killing processes on its own. I recall it takes ~ 30 minutes to get to that point.
        a month later

        Note just checked with latest RC [Version 0.99.128-rc (WebKit 619.1.11.111.2) / Build date Jul 10 2024] on Mojave and still have same issue.

          Vlad unstickied the discussion .
            2 months later

            Hello. I've noticed recently that Orion is using a lot of RAM. Sometimes, it can use up to 22 GB of RAM with around 15-20 total tabs open which is a lot. For example, when I had two tabs open, (Gmail and Google Docs) Orion used around 6 GB of RAM, while other browsers I tested with those same two tabs used less than 2 GB.

            I expect that Orion shouldn't be using as much RAM.

            Version 0.99.128.2.1-beta (WebKit 619.1.11.111.2)

            Sequoia (15)

            • Vlad replied to this.
              Merged 2 posts from Orion Using Excessive Ram.
                a month later
                Vlad changed the title to Check Memory usage .

                  FYI I still see high memory usage over time. In this case I had Orion open since ~ Sunday and after finally working through all my windows and tabs, Orion's Memory Used was still 3GB -- with about 2 GB App Memory and 800 MB Compressed.

                  Here's a snapshot from Activity Monitor with Orion still running but all windows closed:
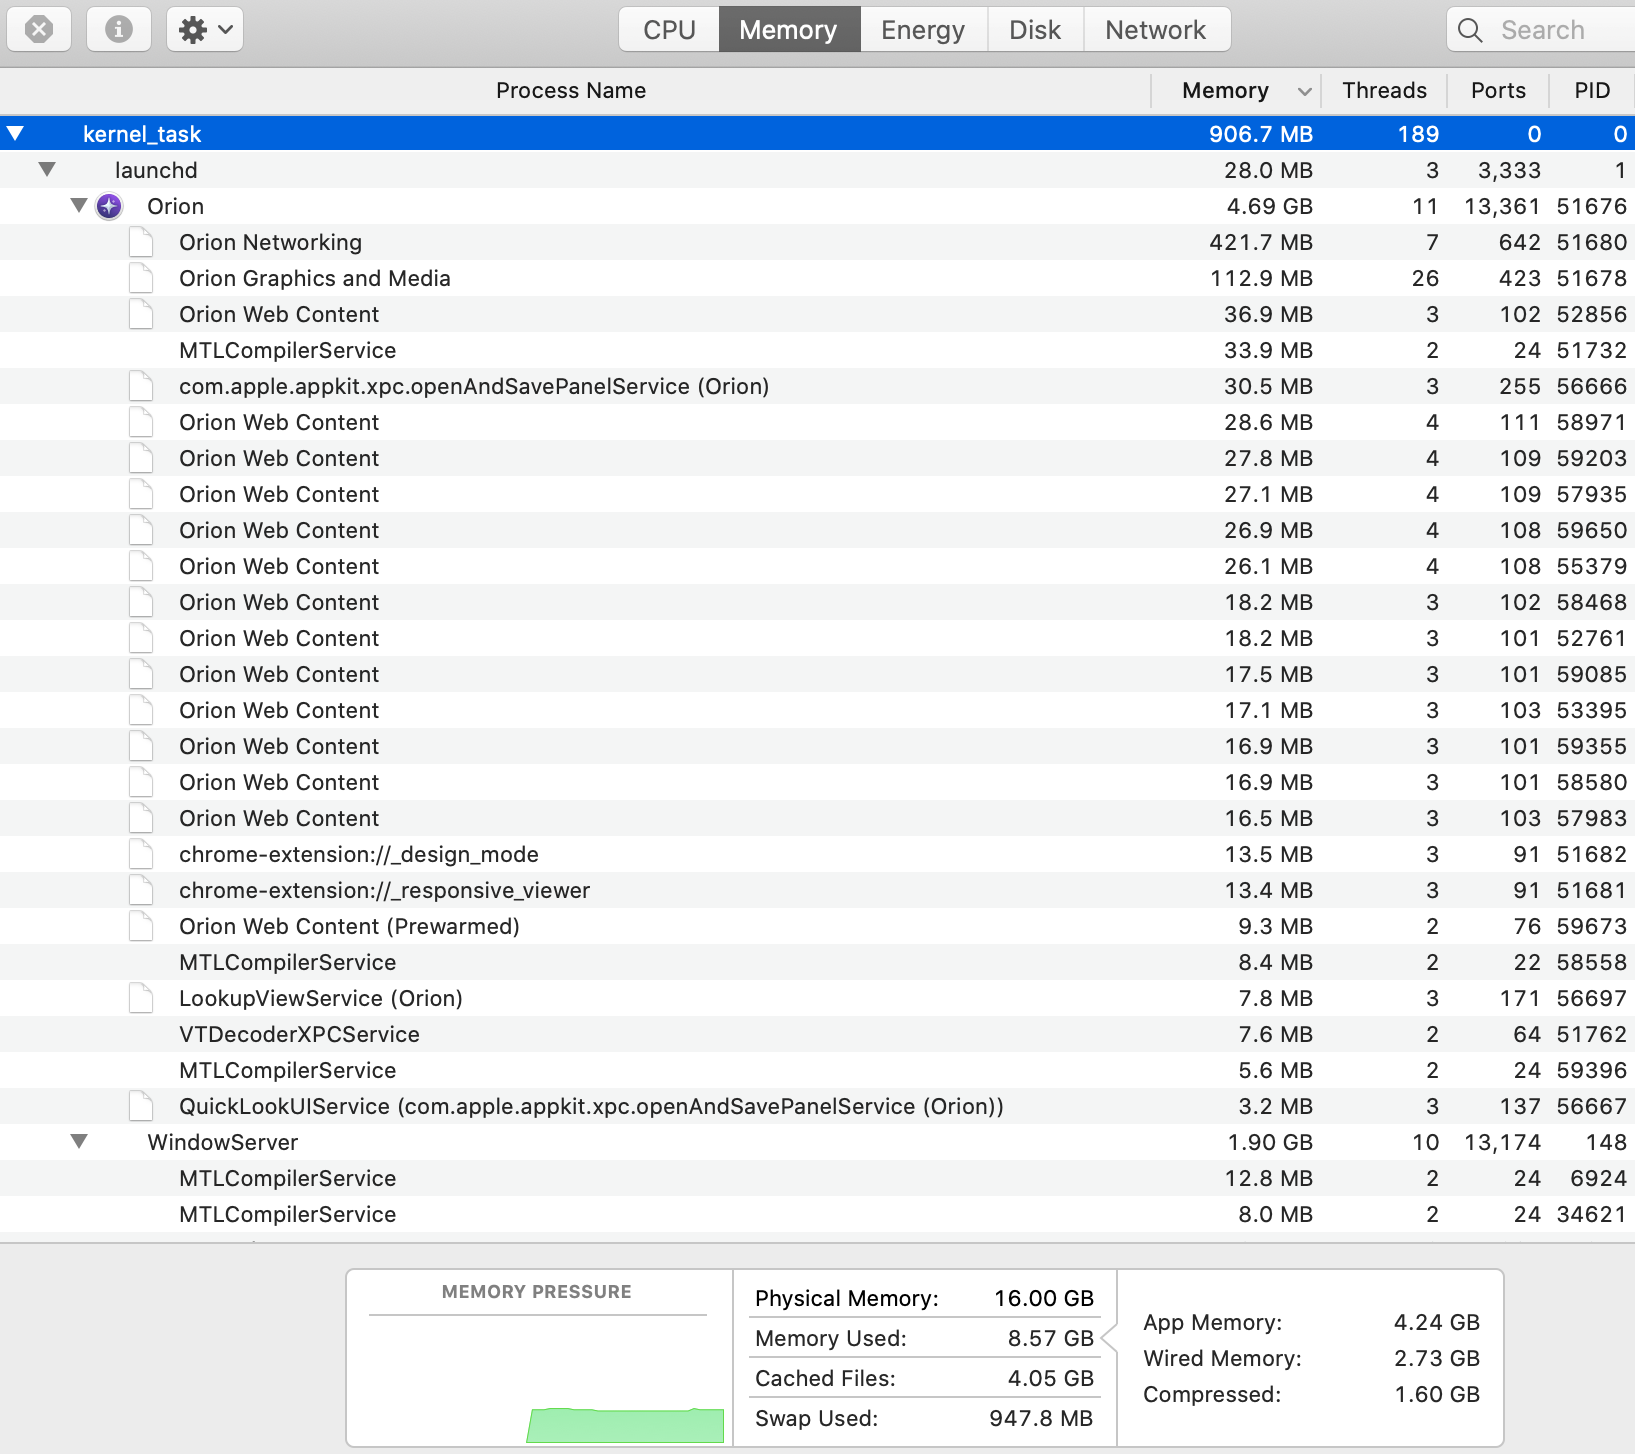
                  After I closed Orion, Memory Used went down to 5.57 GB, App Memory down to 2.13 GB, and Compresssed to 855 MB. I also saved a Sample of the Orion process in case that is helpful to share.

                  While the above summary does not provide quickly reproducible steps, the issue is not intermittent. It does happen to me every time I keep Orion open for a long time. My typical session is ~ dozen windows and ~ 20-something tabs, which I don't think is a lot relative to many other people. I do open and close a lot of windows throughout the day though. If there are additional things to capture next time this happens please let me know.

                  The usability issue around this is that as Orion's memory usage grows, it's working memory gets pushed into Compressed. Once that happens, Orion feels sluggish until it is restarted. Every "New Window" or "Open Location" is a slight hesitation relative to the snappiness of a fresh session.

                  Ideally Orion's memory usage after all windows/tabs are closed from a long session would be the same as if it is when it is opened fresh (with no windows/tabs open). I state this as a goal in the sense that its memory usage would be the same during a long session as the equivalent fresh session restoring the previous session (i.e. presumably the minimum for that set of windows/tabs).

                  I bet Orion snappiness would also be better over long sessions if Orion, or at least its main UI/UX and networking processes and the process for the foreground tab, never spilled into Compressed memory and were last to be swapped to disk out of all its processes. Almost like OS kernels never used to get paged to disk.

                  Version 0.99.128.2.1-beta (WebKit 619.1.11.111.2) Build date Aug 3 2024 MacBook Air (macOS Catalina 10.15.7 build 19H2026)

                  Catalina (10.15)

                  • Vlad replied to this.
                    Merged 1 post from High memory usage over time.

                      bzgnyc Do you have steps to reproduce this from a new clean orion profile?

                        5 days later

                        Vlad That's what I was trying to say -- it is reproducible in that it always ends up that way but it happens over extended sessions so I don't have a concise set of steps to reproduce.

                        Almost the opposite in that if I have Orion set to save my session and reopen the same on startup, the restarted Orion uses a lot less memory than what Orion was using just prior to quit with the same windows. As you can see in the snapshot, there were 0 windows/tabs open but still 13 processes and 3GB of RAM being used after I closed all tabs/windows after an extended session before I quit. A fresh Orion session starts out at 150MB.

                        I realize that doesn't give you a lot to go on which I was asking for additional things I can capture when this happens. Or additional options I can give Orion before starting an extended working session so that I can give you more debugging info once it does happen.

                        • Vlad replied to this.

                          bzgnyc I appreciate the description and yes it does not leave us much to work with. In a situation where we have over 2000 well defined issues, chasing a ghost is not a good use of our limited time. Hoping for reproducible steps.

                            Vlad Okay I admit I didn't know there are 2000 other issues out there... If you have suggestions on how an end-user can track down issues like this much appreciated. I am happy to do the legwork.

                            By the way the good news is that most of the easily reproducible crashing bugs in Orion have been squashed. The bad news is that leaves intermittent ones with no obvious sequences to reproduce...

                            Side note: I had two crashes in Orion recently -- both SEGV and I assume from null pointer dereferencing as the crash report included a message along the lines of "KERN_INVALID_ADDRESS at 0x0000000000000110". However the crashes appeared to be in the WebKit thread (both times under WKImmediateActionController immediateActionRecognizerWillPrepare). I assume that normally crashes in WebKit are best reported directly to that project though does that still hold for the Mojave/Catalina builds?

                            • Vlad replied to this.

                              bzgnyc

                              Okay I admit I didn't know there are 2000 other issues out there...

                              There are 2786 issues open at this moment to be exact! Good news is we squashed 3289 issues so far!

                              If you have suggestions on how an end-user can track down issues like this much appreciated.

                              The details of what we need to fix this are explained in this post:

                              https://orionfeedback.org/d/4480-check-memory-usage/54

                                10 days later

                                Orion eats up 10 Gb of Ram with 14 tabs, 4 of them only images.

                                I have Upwork and github open up.

                                Safari wouldn't use that much memory on my mac.

                                Expected:
                                Only a few RAM should be used by Orion.

                                Version 0.99.128.2.1-beta (WebKit 619.1.11.111.2)

                                Sequoia (15)

                                  Merged 2 posts from Orion eats too much RAM.