- Edited
It would be nice to be able to have effectively Eruda/vConsole/mdebug/firebug lite as a built in set of tools to launch.
I don’t really know what the implementation looks like. Ideally you’d have a real set of developer tools that look and act as close as possible to Chrome’s DevTools. If that is out of the realm of possibility then all of the examples I gave above are JavaScript implementations of DevTools and can all be found on GitHub. Currently I launch then via bookmarklet.
A command line like chrome’s inspect element to be able to execute code in a console
We need exact specification of the minimal functionality to be added. Everything so far in this thread is very vague.
Brief Summary
Adding the Same/Similiar features as Chrome’s developer tools as a Pop-up for iPhone Orion App Websites.
Details:
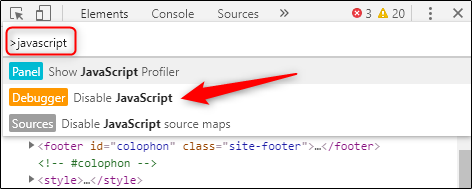
A user would open the Orion Settings and tap “Developer Tools”, then a small Pop-up they readjust to their needs on the left/right side of the screen would have tabs such as “Elements”, “Console”, and “Network”. The user could click Elements, Select an element from the screen, and then edit/remove it. The User could also go to the Console and run JS Commands or edit settings such as manually turning off JavaScript [Please do this b/c Anti-Anti-Adblock isn’t working on here] for different sites. The User could also go to network and see the contents and HTML requests sent to the webpage and be able to download those files and inspect them for personal use.
Image/Video:
When are you planning on adding these?
Still can't properly debug Extensions without DevConsole or Extension Console in iOS...