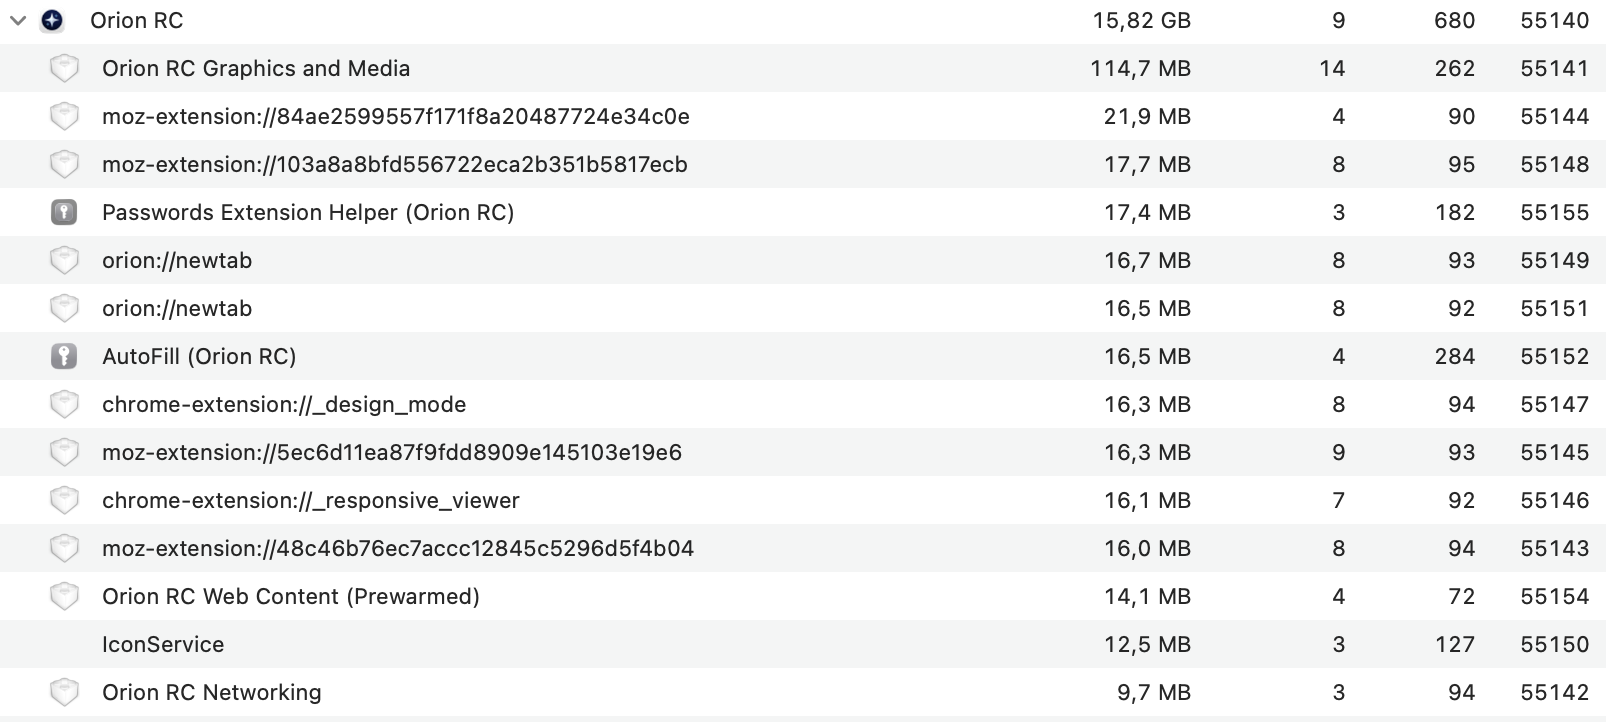
What happened? How did it happen? What are the steps to replicate the issue.
I'll post here since it's more related to create new thread. As I've written before, I set it up on a new, clean profile. However, a few hours after my post in the previous thread, the memory consumption for the Orion RC process grew to 5+ GB (sometimes spiking to 15 GB), while all tabs and extensions seem to be within normal limits.

I've tried toggling various settings, disabling or enabling site settings, turning off the content blocker, changing the tab display, switching Low Power Mode, and enabling Compatibility Mode for all sites.
I've managed to pinpoint the problem. A sharp increase in RAM usage occurs after I visit my self-hosted Dokploy. Closing the tab and restarting the browser doesn't help. The only solution is to clear the Cache, Local Storage, and other data in "Manage Website Data...", remove it from history(just in case) and browser restart. I just tried to reproduce the issue on the Cloud version of Dokploy, and it happened, even though I don't think I was able to before.
The issue doesn't happen in Safari or on a clean profile (only after some time).
Expected behaviour:
The "Orion RC" parent process to use <1GB of RAM, similar to when using a fresh profile
What version of Orion are you running?
Version 0.99.136.2-rc (WebKit 623.1.8.0.0)
Tahoe (26)